How We Built DashOpus: Turning Business Questions into Data Dashboards
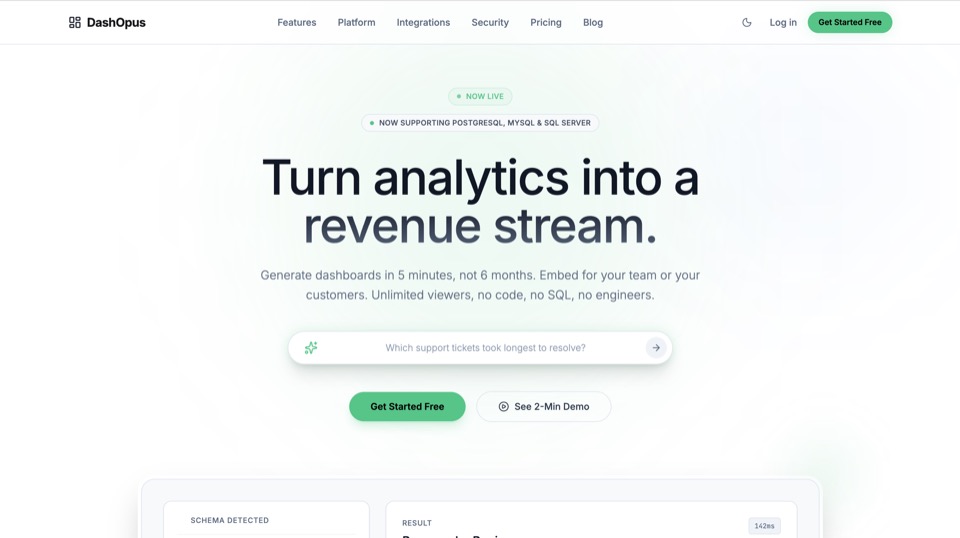
DashOpus is a product we designed, built and run ourselves. A user connects a database, asks a question in plain English, and gets back a chart they can place on a dashboard, share, or embed in their own application. Once a database is connected, a question typically becomes a chart in about a minute. This article explains the decisions behind it. It is not a client case study.
The problem
Most business questions have answers sitting in a database. Getting them out usually means asking someone who can write SQL, waiting for a report, or buying a BI tool that still needs technical setup. Product companies have a second version of the problem: their customers want analytics inside the product, and building that from scratch takes months of engineering. DashOpus addresses both: internal dashboards for a team, and embedded dashboards for a product's own customers.
Connecting data
DashOpus connects directly to PostgreSQL, MySQL and Microsoft SQL Server, and accepts CSV and Excel uploads. When a database is connected, it reads the schema, meaning table names, columns, types and relationships, so the AI knows what data exists. It does not copy the customer's data into DashOpus.
Two rules shaped this part of the system from the start. Connections only need, and only use, read-only access, so DashOpus cannot modify or delete anything in a customer's database. And connection credentials are stored encrypted, separately for each customer account.
From question to SQL
When a user asks something like which customers spent over $10K last quarter, DashOpus generates the SQL to answer it, in the right dialect for the connected database. Real business questions are rarely a single simple query, so the system has to produce complex SQL, and sometimes additional logic, rather than filling in a fixed template.
No single model is best at every step. DashOpus orchestrates several: a model specialised in SQL generation, alongside general-purpose models such as Google's Gemini and OpenAI's GPT models for understanding the question and handling follow-ups. Users can refine a result by asking follow-up questions, and their conversation history is kept so they can revisit earlier analyses.
From results to dashboards
Each answer becomes a chart that can be dragged onto a canvas, resized and arranged into a dashboard. Dashboards refresh automatically on a schedule, from every few minutes to hourly, and users can edit, save and share them. Sharing works through public links, optional password protection, iframe embeds, and token-based embedding for products that show dashboards to their own customers under their own brand.
The hardest problem: row-level security
The most difficult engineering problem was row-level security. When a company embeds one dashboard in its product, hundreds of its own customers may view it, and each of them must only see their own rows. That is hard enough with hand-written reports. With AI-generated SQL it is harder, because the query is different every time and is written by a model, not reviewed by a person.
The principle we worked to is that the restriction has to hold whatever SQL the model writes. Asking the model to remember to add a filter is not a security control. Getting this right took more design and testing than any other part of the product, and it is now a feature of the higher DashOpus plans.
Multi-tenancy and hosting
DashOpus is a multi-tenant product: every customer account has its own connections, dashboards and settings, isolated from every other account. It runs on AWS and Railway.
Pricing as a product decision
DashOpus has a free plan for individuals and paid plans for teams and for products that embed analytics, with a custom Enterprise option. The paid plans charge a flat monthly price with unlimited viewers rather than a fee per viewer, because per-viewer pricing makes embedded analytics expensive for exactly the companies that need it most. Current plans are listed on the DashOpus website.
What building it taught us
- Read the schema, not the data. Understanding structure is enough to write good queries, and it keeps customer data where it belongs.
- Read-only access removes a whole class of risk. It is the first thing a cautious buyer asks about.
- Use more than one model. Specialised and general models are each better at different steps.
- Security that depends on the model behaving is not security. Row-level rules have to hold regardless of the generated query.
- Pricing is architecture. A flat-price, unlimited-viewer model only works if the system is efficient per query.
We apply the same lessons when we add AI to client software: keep data access narrow, design permissions into the data layer, and treat the model as one component of a larger system.
You bring the problem. We figure out the technology.
No sales pressure. We will first understand what you are trying to fix, then tell you honestly how we would approach it, including when the answer is simpler than you think.